Fancy dashboards with 50 metrics look impressive but don't help. You need 5-7 visual indicators you can check in 30 seconds and know exactly where your project stands. A contractor app with dashboard features can provide these KPIs. Here they are.
The 5 Essential KPIs for Construction Sites
1. Schedule Performance (Are we on time?)
What it shows: Actual progress vs planned progress
Visual: Line graph with two lines
- Blue line: Planned progress
- Green/Red line: Actual progress (green if ahead/on-track, red if behind)
How to read:
- Lines together = On schedule
- Actual above planned = Ahead of schedule
- Actual below planned = Behind schedule
Target: Stay within ±5% of planned
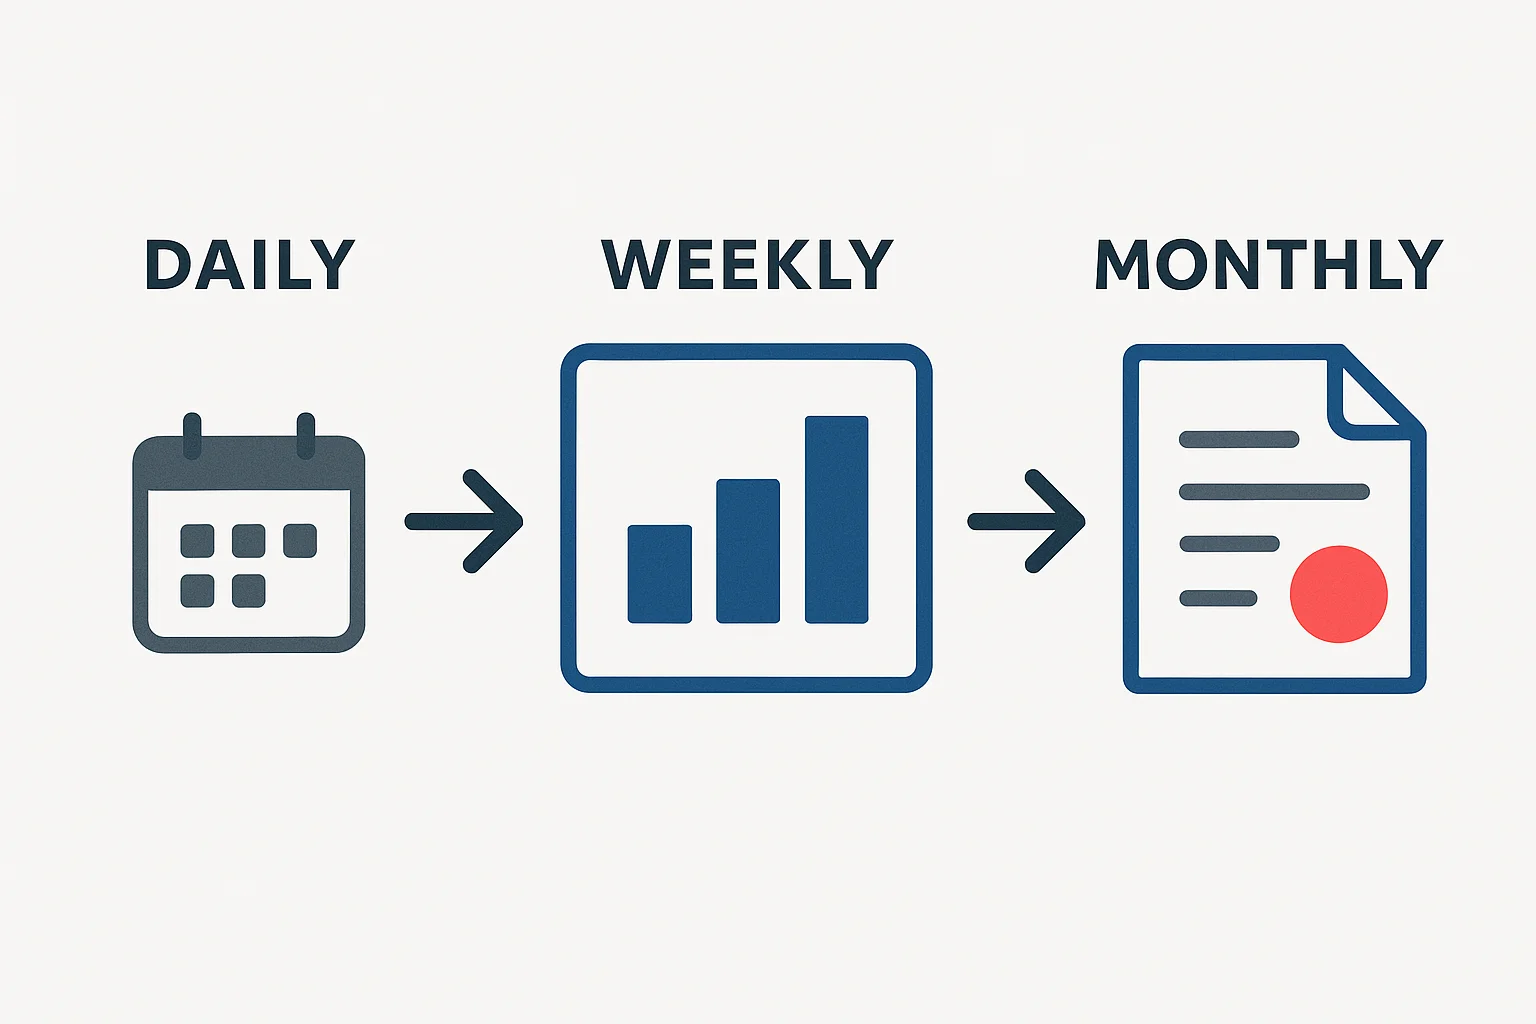
Check frequency: Daily
2. Task Completion Rate (Are we getting things done?)
What it shows: Percentage of planned tasks completed each week
Visual: Bar chart, one bar per week
- Target line at 100%
- Bars above 100% = Exceeding plan
- Bars below 100% = Missing targets
How to calculate: (Tasks completed this week / Tasks planned this week) × 100
Target: 95-105% consistently
Check frequency: Weekly
3. Labour Utilization (Are workers productive?)
What it shows: Percentage of available labour hours actually worked
Visual: Pie chart or percentage gauge
- Green slice: Productive time
- Yellow slice: Necessary idle (breaks, curing waits)
- Red slice: Avoidable idle (delays, waiting)
How to calculate: (Productive hours / Total hours) × 100
Target: Greater than 85% utilization
Check frequency: Weekly
4. Quality Index (Are we doing it right?)
What it shows: Percentage of work passing quality inspection first time
Visual: Percentage gauge with color zones
- Green (95-100%): Excellent
- Yellow (85-95%): Acceptable
- Red (less than 85%): Problem
How to calculate: (Work passing inspection / Total work inspected) × 100
Target: Greater than 95%
Check frequency: Weekly
5. Budget Performance (Are we profitable?)
What it shows: Spending vs budget
Visual: Bar chart comparing planned vs actual costs
- Green bars: Under budget
- Red bars: Over budget
- Percentage variance shown
Target: Within ±5% of budget
Check frequency: Weekly
Bonus KPIs (Add if Needed)
6. Safety Incidents
What: Number of safety incidents per week
Visual: Line graph (goal: trending down to zero)
Target: Zero incidents
7. Material Consumption Rate
What: Actual vs expected material usage
Visual: Bar comparison
Target: Within ±10% of estimates
The One-Page Dashboard
Combine all KPIs on one screen/page:
[Project Name] - Weekly Dashboard
Week ending: [Date]

[Schedule Performance Graph]
Status: [Icon] 2% behind schedule

[Task Completion Bar]
This week: 92% (Target: 100%)

[Labour Utilization Pie]
85% productive | 10% breaks | 5% idle

[Quality Gauge]
96% pass rate - Excellent

[Budget Status]
3% under budget - ₹1.5L saved

[Safety Counter]
0 incidents this week ✓
Time to review: 30 seconds
Information gained: Complete project status
Color Coding: Universal Language
Green: Good, on track, no action needed
Yellow: Caution, monitor closely, minor action needed
Red: Problem, immediate attention required
Use consistently across all KPIs. Your brain learns the pattern.
Setting Up Visual Monitoring
Week 1: Baseline
- Measure current state
- Set realistic targets
- Create simple tracking sheets
Week 2-4: Refine
- Track consistently
- Adjust targets if needed
- Train team on reading dashboard
Month 2+: Optimize
- Dashboard becomes habit
- Team self-corrects based on KPIs
- Continuous improvement
Tools for Visual KPIs
Manual: Excel/Sheets with charts (works fine)
Semi-automated: Construction apps that calculate automatically
Fully automated: Modern construction management software updates KPIs in real-time
Recommendation: Start manual, upgrade when you see value.
Common Mistakes
Mistake #1: Too Many Metrics
Problem: 20 KPIs = information overload
Solution: Focus on 5-7 that actually matter
Mistake #2: No Action on Red KPIs
Problem: Tracking but not responding
Solution: Red KPI = mandatory discussion and action plan
Mistake #3: Weekly Review Only
Problem: Problems compound before weekly review
Solution: Quick daily glance (30 seconds) catches issues early
Conclusion
Visual KPIs transform project monitoring from guesswork to data. Start with these 5 essentials, add more only if needed.
The goal: Glance at dashboard for 30 seconds and know exactly where your project stands.
Next Steps
- Choose 5 KPIs to track
- Create simple dashboard (Excel is fine)
- Start tracking this week
- Review and improve
Learn More
Ready to Transform Your Construction Business?
Start managing your sites efficiently with Yojo today.
Try Yojo FreeConstruction Management Expert
Senior Construction Consultant at Yojo
10+ years of experience
Reviewed on 6 January 2025
About Yojo Team
Construction management expert with 10+ years of experience helping Indian contractors build better businesses. Specialized in digital transformation for construction sites.